CAMBRIDGE IELTS 16
TASK 1- TEST 1
Chào các bạn, mình là Khang đến từ Trung tâm Ngoại ngữ IELTS MASTER – ENGONOW. Hôm nay mình rất vui khi có thể chia sẻ đến các bạn bài mẫu đề thi Task 1 mới nhất trong Cambridge IELTS 16 nhé.
GIỎI TIẾNG ANH – CHUẨN IELTS – HỌC IELTS MASTER

The charts below show the changes in ownership of electrical appliances and amount of time spent doing housework in households in one country between 1920 and 2019.
Summarise the information by selecting and reporting the main features, and make comparisons where relevant.

Sample:
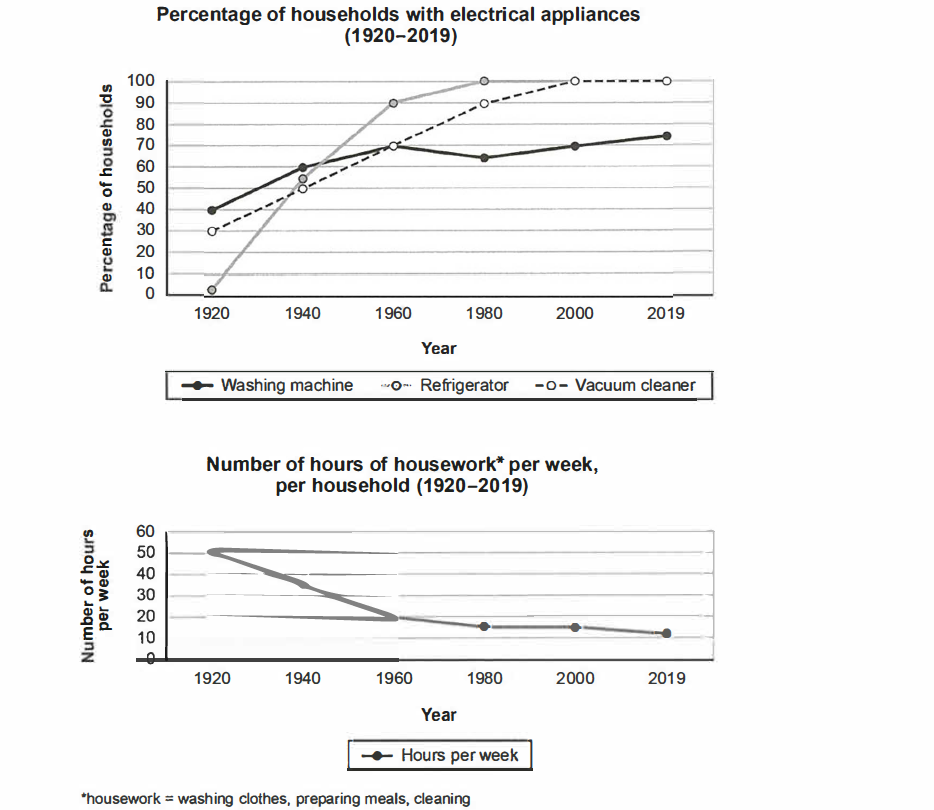
The first line chart illustrates the proportions of households owning washing machines, refrigerators and vacuum cleaners while the second one depicts how much time per week every family expended on household chores from 1920 to 2019 in one particular nation.
Overall, it is notable that while the figures for the utensils witnessed a strong surge, the opposite was true for the time quantity. In addition, refrigerators and vacuums gained substantial popularity, making them the most common at the end of the period.
Upon a closer look at appliance ownership, in 1920, the percentages of homes having refrigerators and vacuums were nearly 3% and 30%, respectively. During the next ten decades, the former skyrocketed to its peak of 100% in 1980, followed by a plateau, whereas the latter soared to 100% in 2000, then remained unchanged. As for washing machines, ownership was much higher than the others initially, at 40%. However, it experienced a slower growth to just 70% between 1920 and 1960, but later dipped slightly by about 5% in 1980 and recovered steadily to approximately 75% by 2019.
Turning to the figures for hours spent on housework weekly, a plunge from 50 to 15 was seen over the first 60 years, and it then marginally declined to 10 hours by 2019.
(được viết bởi thầy Khang- đạt band 7.5+, được chấm bởi thầy Mike- IELTS Examiner)
Tạm dịch:
Biểu đồ đường đầu tiên minh họa tỷ lệ hộ gia đình sở hữu máy giặt, tủ lạnh và máy hút bụi trong khi biểu đồ thứ hai mô tả thời gian mỗi gia đình dành cho việc nhà từ năm 1920 đến năm 2019 tại một quốc gia.
Nhìn chung, trong khi số liệu của đồ dùng thiết bị tăng mạnh, thì số liệu về thời gain sử dụng có xu hướng ngược lại- giảm mạnh. Ngoài ra, tủ lạnh và máy hút bụ ngày càng phổ biến, và vào cuối giai đoạn khảo sát, nhóm thiết bị này trở thành phổ biến nhất.
Xem xét kỹ hơn, vào năm 1920, tỷ lệ hộ gia đình sở hữu tủ lạnh và máy hút bụi lần lượt là gần 3% và 30%. Trong suốt mười thập kỷ tiếp theo, số liệu của tủ lạnh tăng vọt và đạt đỉnh tại 100% vào năm 1980, và sau đó ngừng tăng; trong khi máy hút bụi tăng nhanh, đạt 100% vào năm 2000 và giữ nguyên không đổi đến cuối thời kỳ. Tỷ lệ sở hữu máy giặt cao hơn nhiều so với các thiết bị khác tại đầu thời kỳ, ở mức 40%. Tuy nhiên, thiết bị này đã tăng trưởng chậm hơn, chỉ đạt 70% từ năm 1920 đến năm 1960, nhưng sau đó giảm nhẹ khoảng 5% vào năm 1980 và phục hồi lên khoảng 75% vào năm 2019.
Chuyển sang số liệu về số giờ dành cho việc nhà hàng tuần, con số này sụt giảm mạnh, từ 50 xuống còn 15 trong 60 năm đầu tiên và sau đó giảm nhẹ còn 10 giờ vào năm 2019.


